National Debt Clock Campaign
Case Study
The Brief
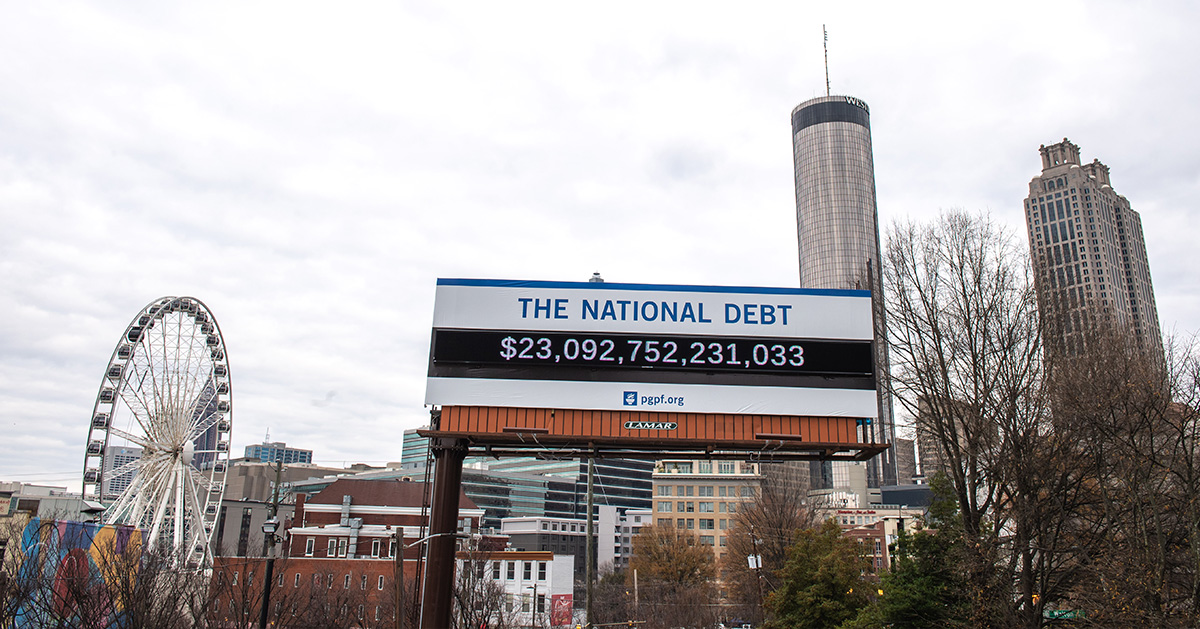
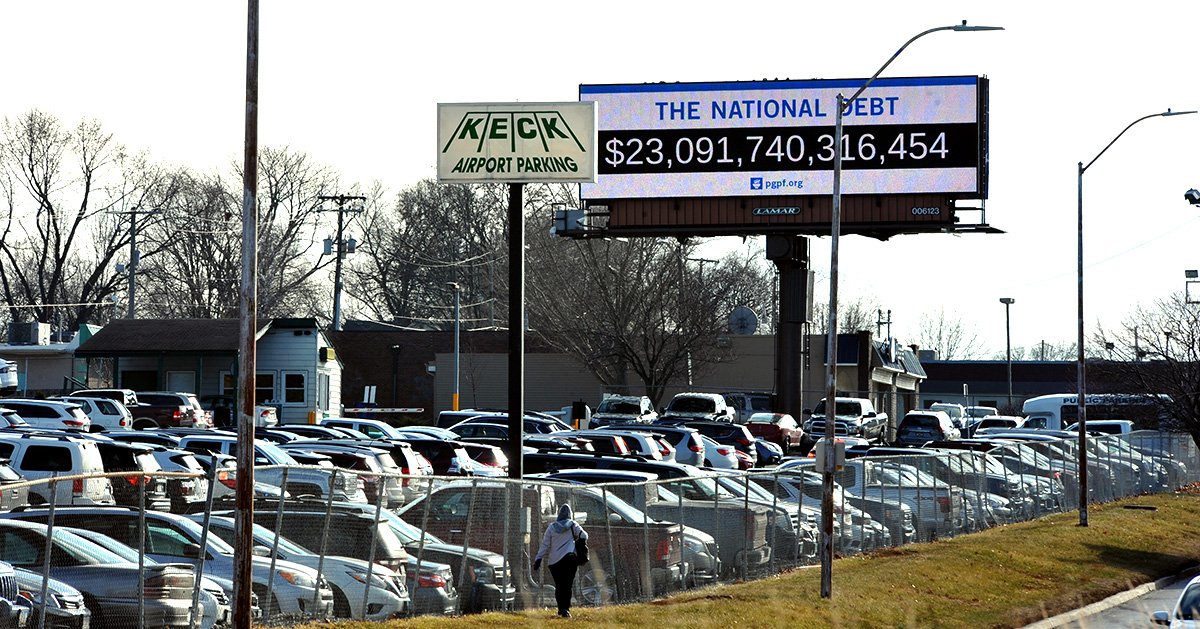
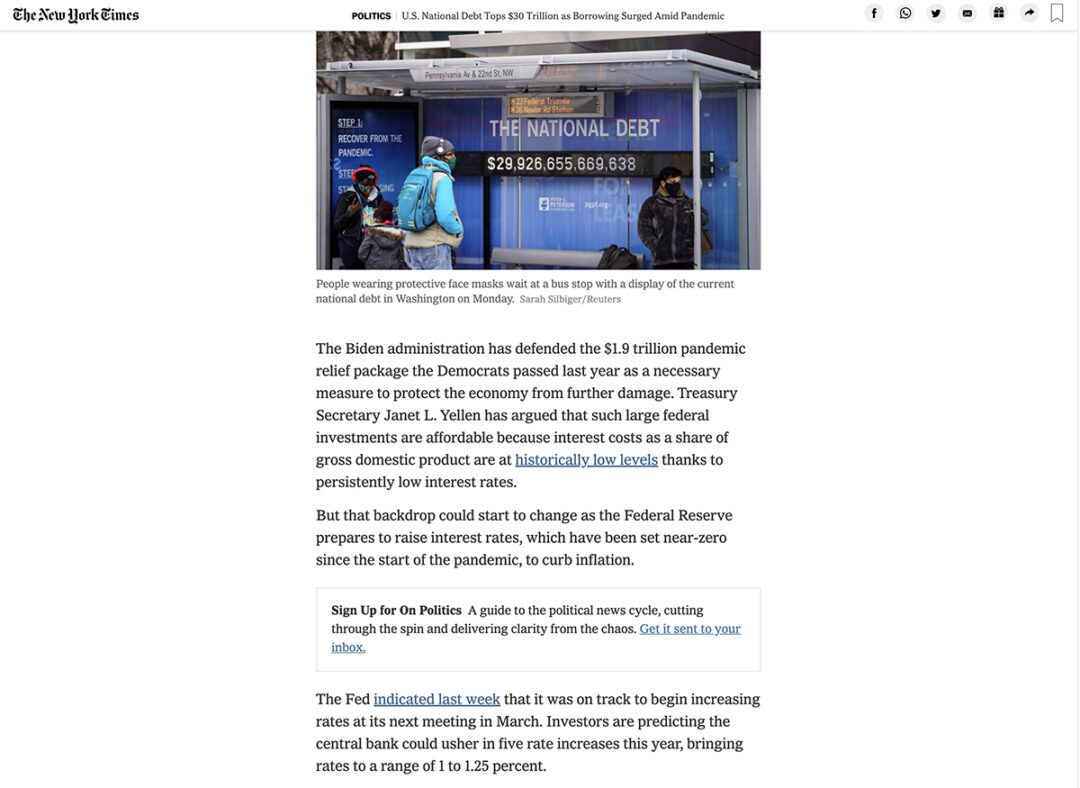
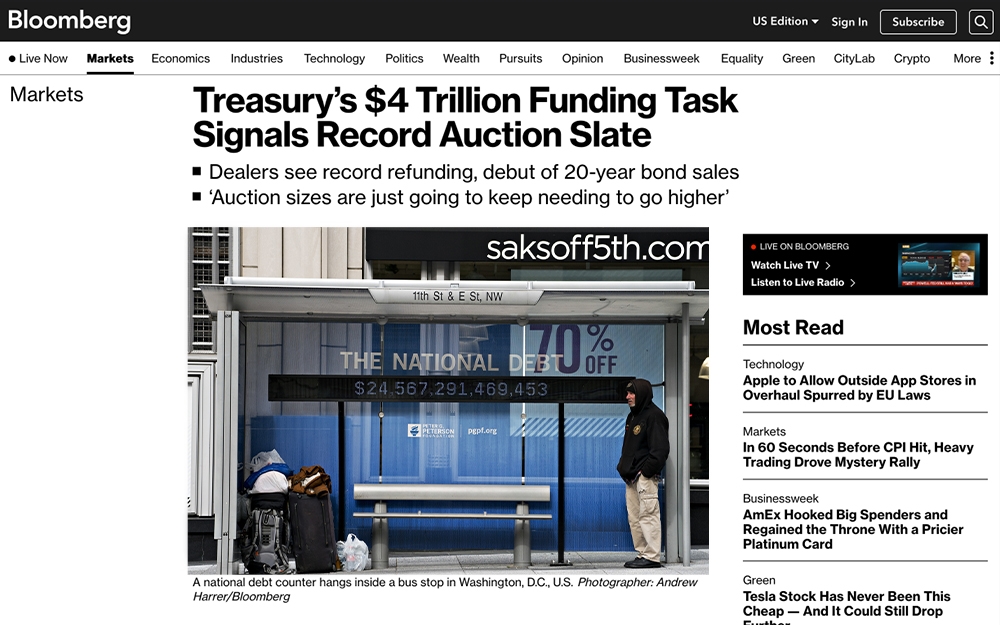
Launch a series of national debt clocks in select cities around America and develop a microsite in conjunction with the release of the physical debt clocks for the non-partisan; non-profit Peter G. Peterson Foundation. The billboards are to alternately display gross federal debt and gross federal debt per person.
The objective of this campaign is to raise awareness about the need to address the national debt for America’s future. By injecting only the facts in select cities and developing the most accurate debt clock microsite – the Foundation will be furthering its mission by demonstrating broad public support for fiscal sustainability, provide critical background and context to policymakers and voters, and inspire young people to take action to build a vibrant economic future.
The Solution
In collaboration with the Foundations research team and a group of external developers we developed a living feed that would supply the physical debt clocks and the billboards with accurate daily data. The amount of gross federal debt held by the U.S. Government is released daily by the U.S. Treasury Department at 4:15 p.m. every weekday.
So, how did we get these things to tick?
Since the U.S. Treasury Department only releases the total amount of U.S. debt held once a day, we had to formulate an equation to create the ticking effect to mimick that the debt is constantly rising.
Each business day, the U.S. Treasury Department reports the amount of debt outstanding at the end of the previous business day. Our formula uses that number, as well as debt projections from the Congressional Budget Office (CBO), to estimate the rate at which the debt is currently growing. Our estimates are updated each business day, reflecting the latest information from Treasury and CBO projections that are updated 2-3 times per year.
Debt per person is calculated by dividing the debt outstanding by the population of the United States, as published by the US Census Bureau.
In a nutshell, we take the Congressional Budget Office’s future debt projection (input manually with each new projection) and divide that by the daily Treasury number (scraped from the Treasury’s RSS Debt Feed).
We then take that number, and divide it into equal segments that a .json then feeds to the billboards and thenationaldebt.org microsite feed.
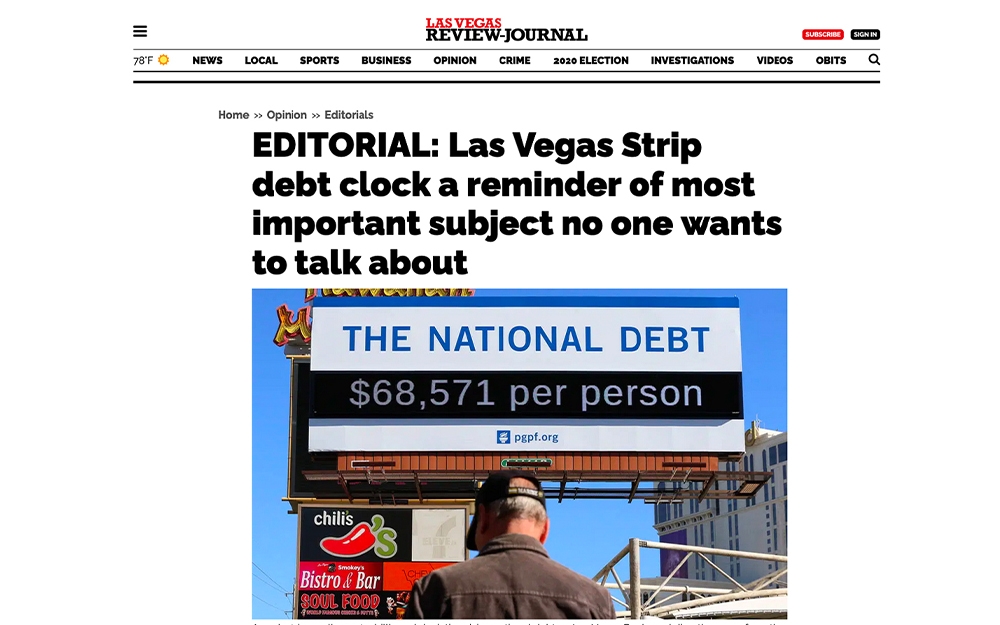
For the billboards, our daily data feed sheets are spliced into 15 second intervals. In each minute the first three 15 second slots represent the national debt number and the last 15 second slot representing the per person number. For the microsite, the national debt feed is in one second intervals.
Challenges and Issues
- Requirements for the billboard feeds and microsites differed. For the microsite feed we could have the number tick at whatever speed we desired. For the billboards, depending on the state, there are laws governing how frequently a billboard can refresh. Rather than building a separate feed for each specific billboard, we took the municipality that required the longest interval of time and set that for the master feed for the billboards. The end result was two feeds. One for the website and one for the billboards.
- Refresh rates and cache clearing. We obviously had to solve this. Prior to launch during our daily testing we found that rather than refreshing the new feed at 4:15 p.m. daily, the billboards just reset at kept running the same data as the previous 24 hours. After much testing between our feeds, our server and the physical billboards the solution was to auto run a cron job daily to flush the caches.
Results
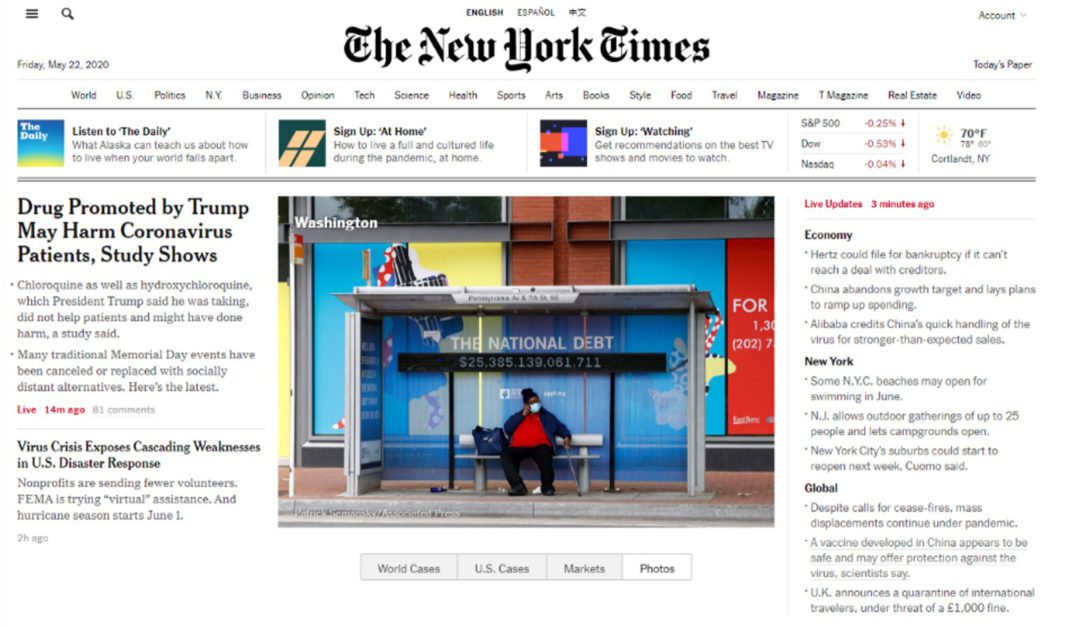
Physical debt clocks are currently located in Atlanta, Cleveland, Des Moines, Las Vegas, Milwaukee, and various bus shelters in Washington, D.C.
Media and Press Pickups
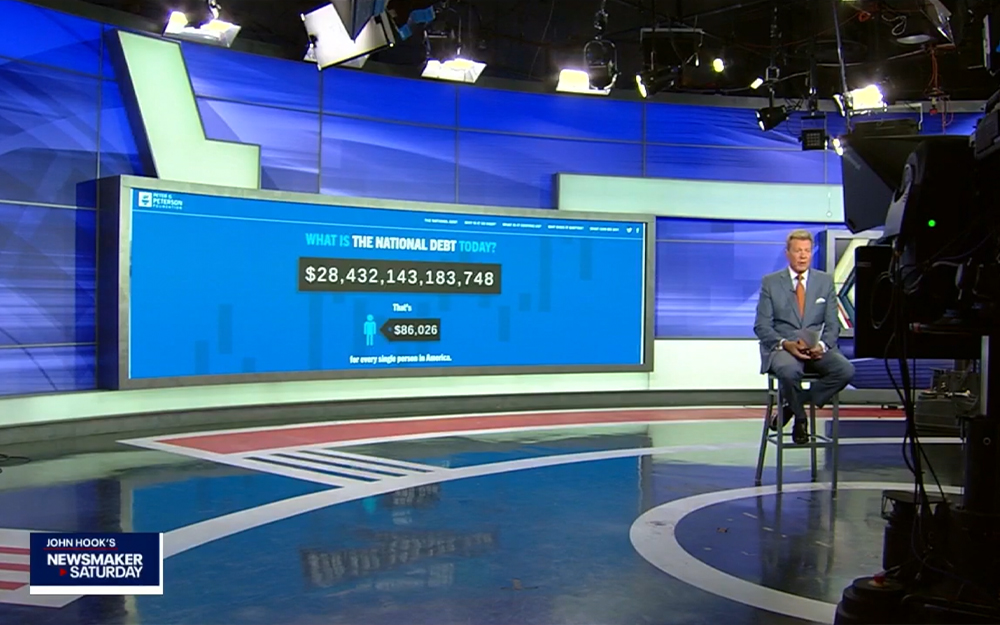
Coverage of the debt clock billboards and digital microsite have been picked up by numerous local and national media outlets. Including, but not limited to, The New York Times, The Associated Press (AP News), Bloomberg, Fox, Forbes, RollCall, C-SPAN, The Atlanta Journal-Constitution, Las Vegas Review-Journal, Milwaukee Journal Sentinel, ABC Milwaukee, NBC Cleveland WKYC, CBS News 3 Atlanta, CBS News “Face the Nation” and Des Moines Register.
thenationaldebt.org
Microsite
The Brief
Create a microsite as the digital version of our physical debt clocks.
The Solution
This presented a golden threefold digital opportunity:
- Build a singular educational page that has the power to be an organic SEO monster.
- Overthrow existing “go to” debt clocks from their google rankings with a more accurate and more visually appealing model.
- Create visual assets that the press, media, journalists and researchers can use (pictures of our debt clocks and use thenationaldebt.org as a link back rather than our competitors).
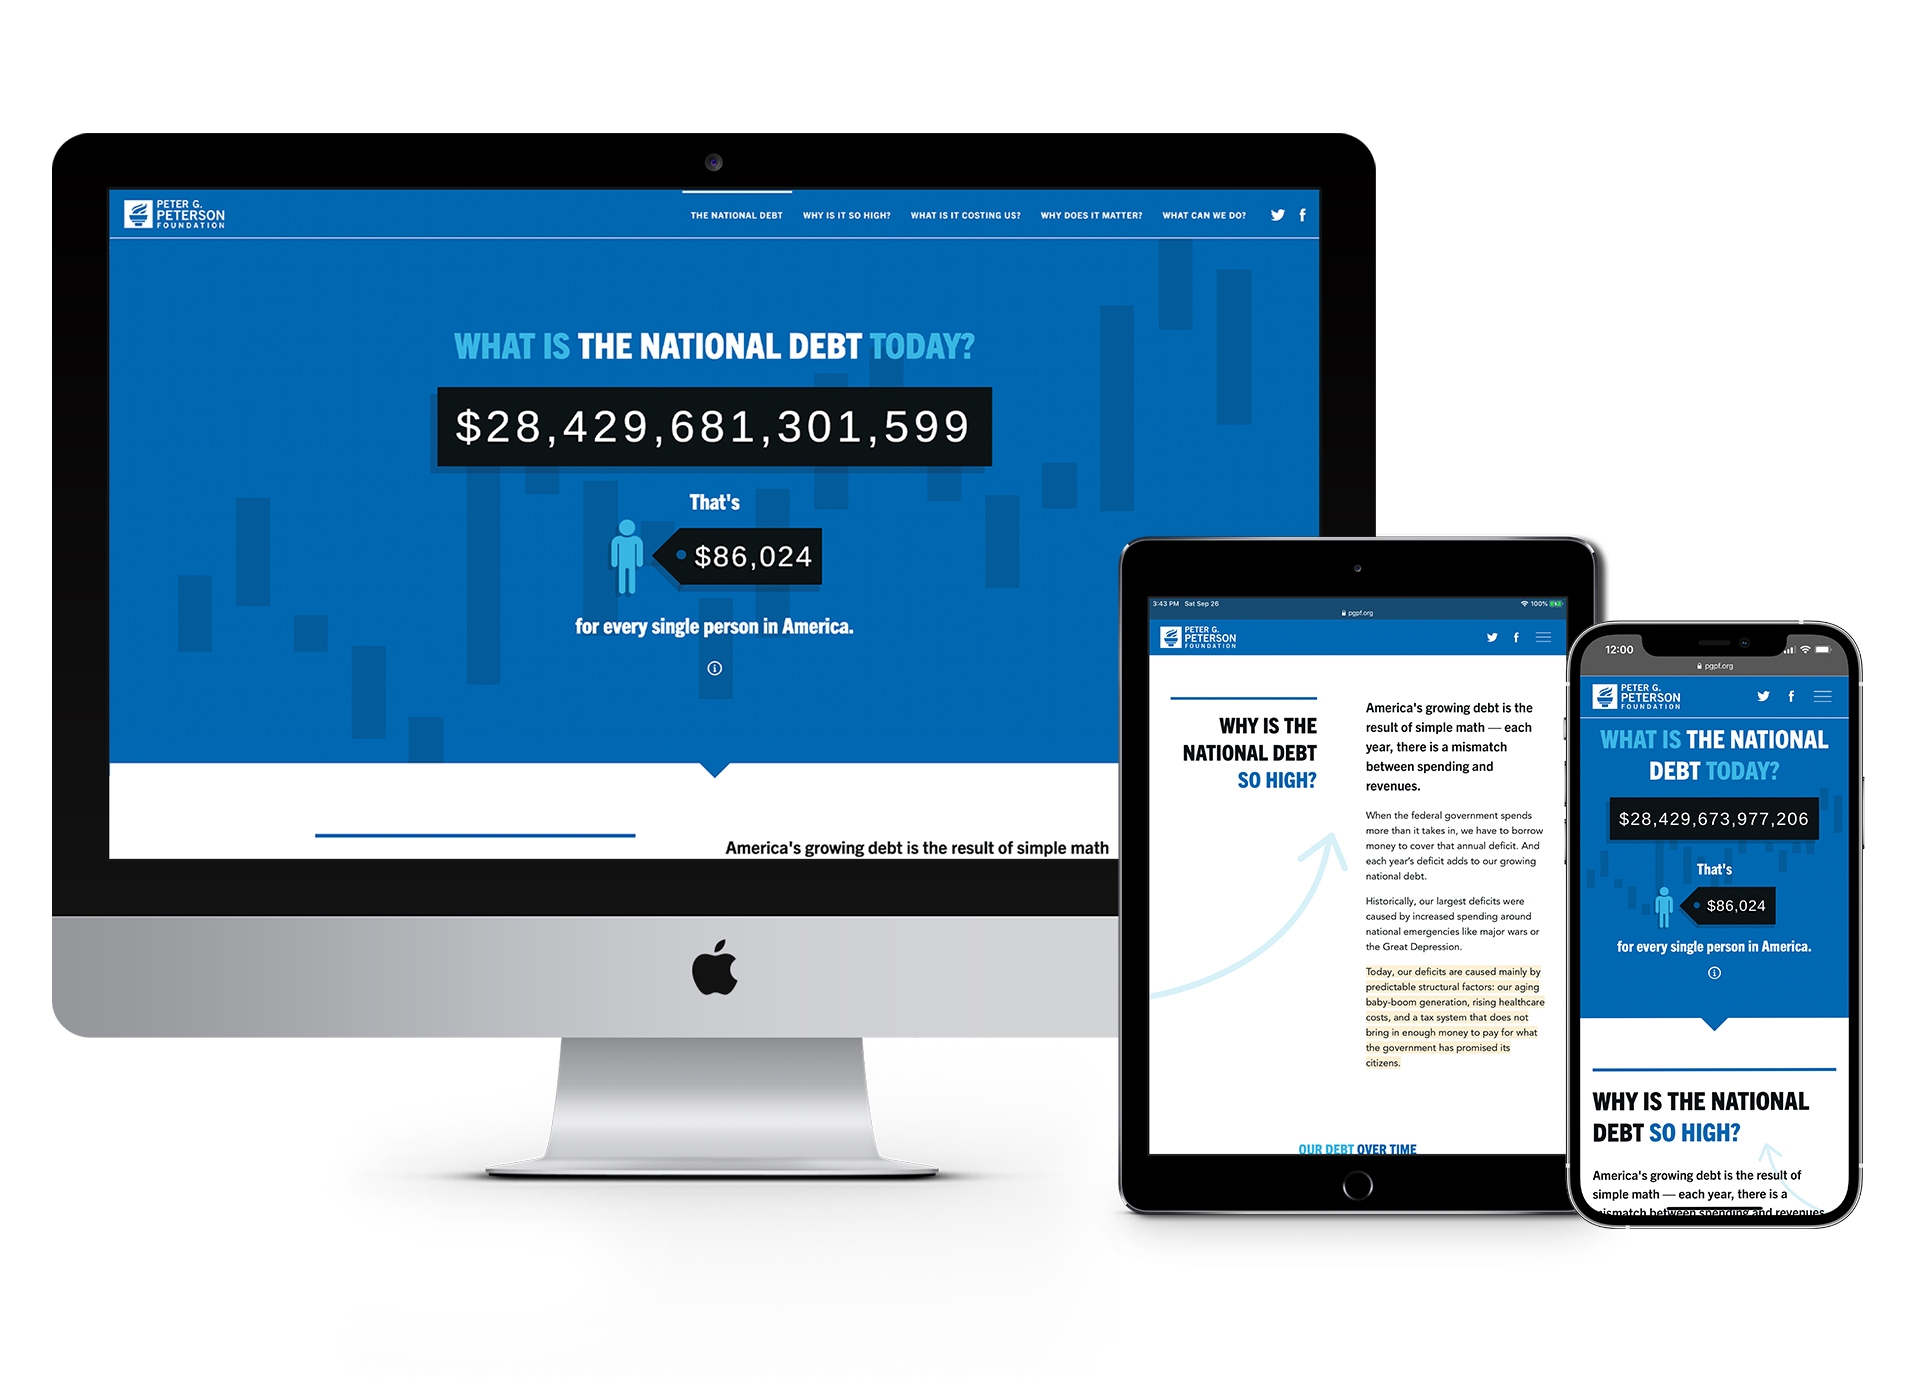
We had to be certain that the site was written in a manner that would be extremely successful in driving organic traffic through SEO. We did this by writing the page in the form of questions common in google searches related to the national debt.
We used deliberate strong semantic tagging, cross linking, links to valuable external sources, and an extensive methodology of our research methods.
- h1 tag of “What is the National Debt Today?”
Followed by h2 tags of:
- Why is it So High?
- What is it Costing Us?
- Why Does it Matter?
- What Can We Do?
Furthermore, we utilized charts.js for some simple interactives and sprinkled in some click to tweets to up the engagement level.
Hover to Scroll Destop Design

Politweets by Whole Whale
Having a clear call to action is crucial on sites like this. For our call to action we tapped our digital consultants at Whole Whale to utilize their politweets tool. There is not much everyday citizens can do about the national debt – except to reach out to their representatives in the U.S. Congress. Politweets does just that!
Building the Engagement Funnel
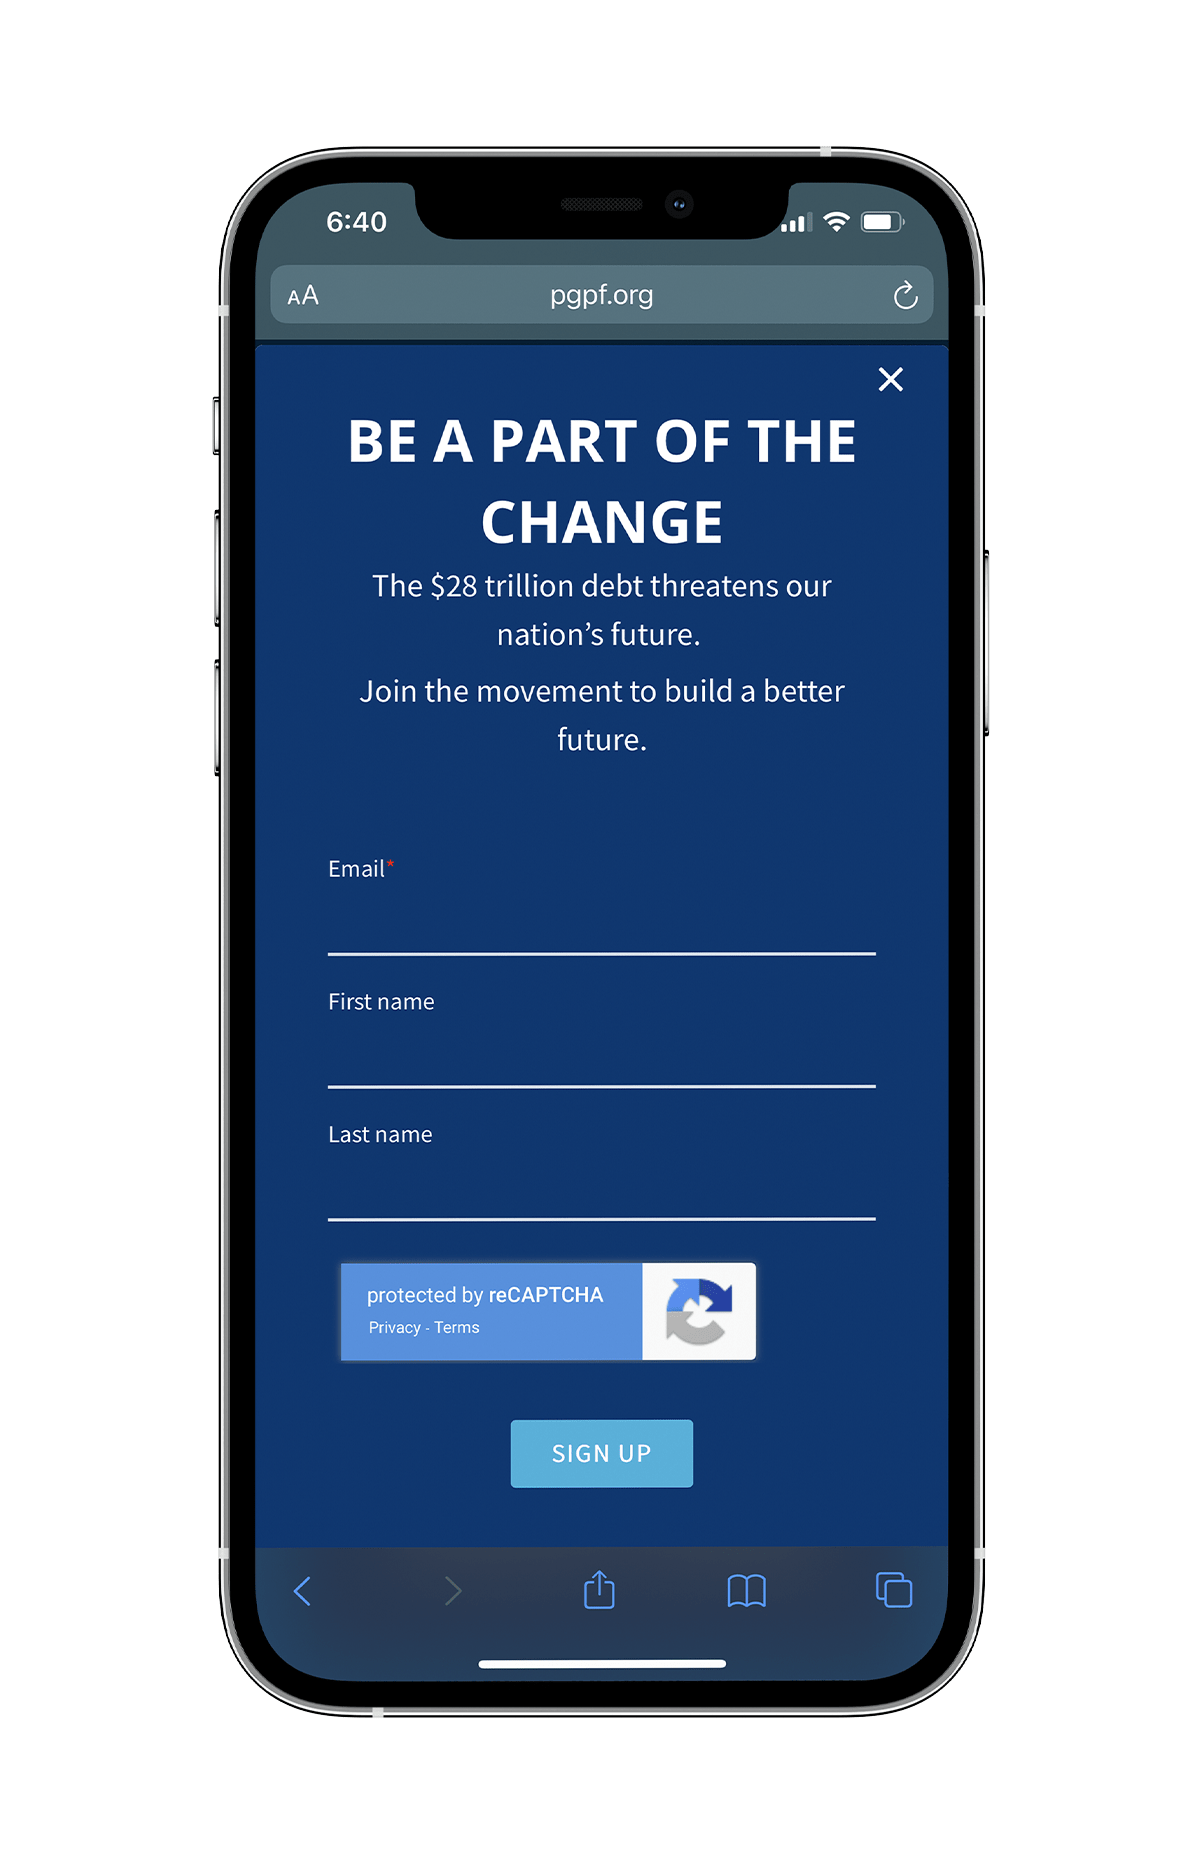
Growing the Peterson Foundations subscription list is vital asset in mission building. For this page we made the ask relatively low. We set up an exit intent pop up as well as an inline form at the end of the page. Users who sign up receive a three part drip campaign on related issues, and are subscribed to our regular newsletters.
Results
Site launched September 2019.
Web traffic analytics from the first year.
(September 2019 – September 2020).
Pageviews
Unique Pageviews
Avg. Time on Page
%
Bounce Rate
Web traffic analytics from the second year.
(September 2020 – September 2021).
Pageviews
Unique Pageviews
Avg. Time on Page
%

